The National Oceanic and Atmospheric Administration (NOAA) recently announced updated vertical clearances for eight bridges between New Orleans and Baton Rouge. The updates aim to enhance navigational safety and efficiency along one of the nation’s busiest waterways.
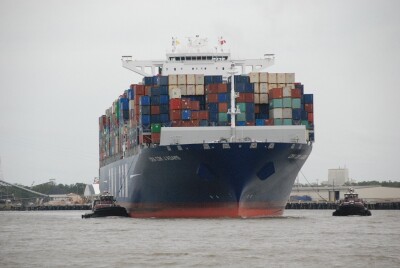
The statement highlighted the Port of New Orleans’ role as a major hub for trade. Spanning both sides of the Mississippi River in Louisiana, the port connects the Mississippi River Valley to inland water routes across the central and southern United States. Navigating the river, however, can be challenging for modern vessels, especially as larger ships face tighter margins under bridges and in channels. Accurate clearance data is critical to ensuring safe and efficient passage.
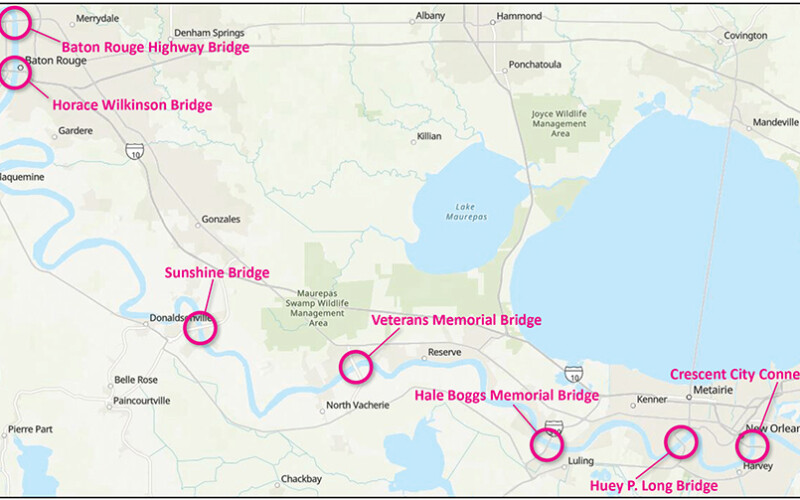
The bridges included in the update are the Crescent City Connection Bridges, Huey P. Long Bridge, Hale Boggs Memorial Bridge, Veterans Memorial Bridge, Sunshine Bridge, Horace Wilkinson Bridge, and Baton Rouge Highway Bridge. Previously, vertical clearance values for these bridges were based on mean high water levels tied to a historic 1927 Flood Stage. This approach often underestimated clearances, not accounting for current water levels or tidal cycles.

NOAA used light detection and ranging (lidar) technology to measure the updated clearances. The 2018 lidar surveys reference the low water reference plane used by the U.S. Army Corps of Engineers (USACE). Mariners can now calculate real-time minimum bridge clearances by subtracting the latest river stage value, available from USACE gages, from the vertical clearance shown on NOAA’s electronic navigational charts (ENC). NOAA provided the hypothetical example that if the Carrollton gage shows a river stage of 4', the minimum clearance for the Crescent City Connection bridges would be 162' (166' minus 4').
Each bridge will feature updated pictorial representations on NOAA’s electronic navigational charts. These graphics will highlight details such as the location of the minimum vertical clearance, air gap sensors, navigation lights, and the relevant USACE gage for determining river stage. To simplify information, clearance values will appear as a truncated value, for instance, 166.6' will appear as 166', however, the pictorial representation will show the exact value of 166.6’.


